stud
bud
Sign up
Log in
Home
Library
Explore
SAT
More
Statistics and Probability: Charts and Graphs Flashcards | StudBud
Explore
/
Statistics and Probability: Charts and Graphs
Statistics and Probability: Charts and Graphs
15 terms
·
StudBud Administration
Short quiz on different types of charts and graphs
Flashcards
15 cards
F
Practice quiz
P
Host live
L
Questions
15
Answers
1
Which of the following describes chart C the best?
Skyrocketing
Staying the same
Climbing Steadily
Spiked, then evened out
2
How many types of graphs did we learn about in class?
4
5
7
6
3
What type of graph is this?
Line
Scatterplot
Flow
Bar
4
This is an example of a(n) ______________________ graph.
Pie
Bar
Flow
Line
5
what type of graph is divided into slices to illustrate numerical proportion
Pie
Line
Bar
Circle
6
What graphs are used to compare things between different groups or to track changes over time?
None
Pie
Bar
Line
7
What type of graph is this?
Line
Scatterplot
Bar
Flow
8
which displays paired data using the vertical or the y axis and a horizontal axis or the x axis
Scatterplot
Pie
Graph
Line
9
What type of graph is this?
Bar
Line
Scatterplot
Flow
10
What type of graph shows progression over time?
Line
Pie
None of the above
Bar
11
Is this a vertical or horizontal bar graph?
Horizontal
Vertical
Neither
12
How many students (452) took less than 85 minutes to finish the exam? boxplot = time to finish
437
23465321232345
4
339
13
Which statement is true about this chart?
A quarter of the categories accounted for half of complaints
The company should provide good training to its workers
The three lowest categories accounted for 10% of complaints.
The wrong carrier accounted for a quarter of all complaints.
14
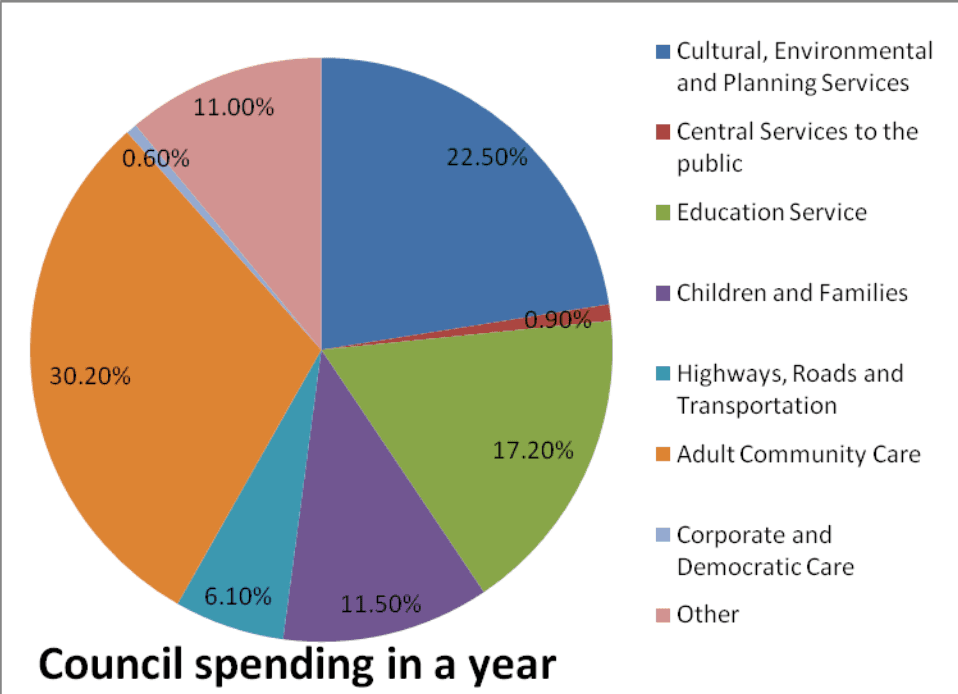
How many parts are in this pie chart?
4
7
5
6
15
What percentage should a Pie Chart add up to?
100%
0%
21%
104%