stud
bud
Sign up
Log in
Home
Library
Explore
SAT
More
Describing Scatterplots Flashcards | StudBud
Explore
/
Describing Scatterplots
Describing Scatterplots
9 terms
·
StudBud Administration
·
2,430 plays
Imported from external platform
Flashcards
9 cards
F
Practice quiz
P
Host live
L
Questions
9
Answers
1
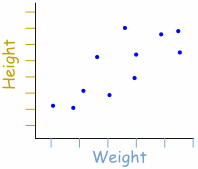
Describe the correlation of this data
none
medium
strong
weak
2
As a person's math final increases, their SAT math score ________________.
decreases
can't tell- no correlation
doesn't change
increases
3
Which of the following words would you use to describe the correlation of this scatterplot?
no correlation
negative
positive
4
Which of the following words would you use to describe the correlation of this scatterplot?
strong
none
weak
medium
5
How would you describe the type of correlation?
nonlinear
linear
6
How would you describe the correlation?
linear
nonlinear
7
Complete this statement: As the number of hours of sleep increases, the test score ___________.
doesn't change
increases
can't tell- no correlation
decreases
8
By determining that the sales at 21 degrees is $480 is an example of __________
interpolation
extrapolation
9
In Nevada, there is ________ correlation between the elevation and the temperature.
strong
negative
positive
weak