stud
bud
Sign up
Log in
Home
Library
Explore
SAT
More
Duplicate of Statistics and Probability: Charts and Graphs Flashcards | StudBud
Explore
/
Duplicate of Statistics and Probability: Charts and Graphs
Duplicate of Statistics and Probability: Charts and Graphs
6 terms
·
StudBud Administration
·
6 plays
Short quiz on different types of charts and graphs
Flashcards
6 cards
F
Practice quiz
P
Host live
L
Questions
6
Answers
1
what type of graph is divided into slices to illustrate numerical proportion
Pie
Bar
Line
Circle
2
to make a pie charts sectors we use
degrees
frequencies
percentages
historgrams
3
What percentage should a Pie Chart add up to?
100%
21%
0%
104%
4
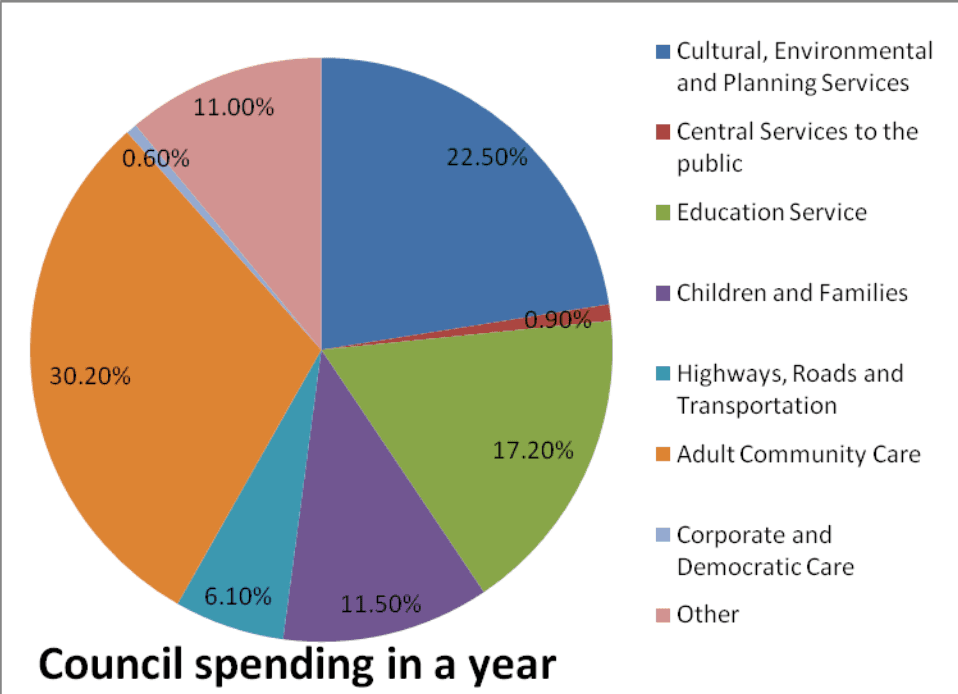
How many parts are in this pie chart?
6
4
5
7
5
visually, on the sectors of a pie chart we label
frequency
the percentages
sum of all the frequencies
the degrees
6
How do we calculate the sectors of a pie chart?
divide the frequency by 360 degrees
frequency/sum of frequency x 360 degrees
?
frequency/sum of frequency x 100