stud
bud
Sign up
Log in
Home
Library
Explore
SAT
More
HSA After School Day 5 Flashcards | StudBud
HSA After School Day 5
1 / 8
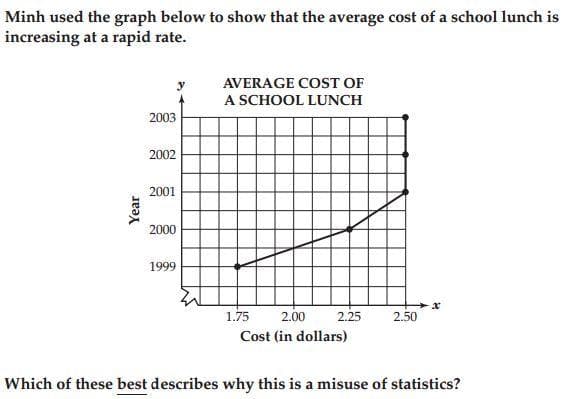
Which of these best describes why this is a misuse of statistics?
A
Graph shouldn't include years where the cost stayed the same
B
Years should be horiz.axis to show how cost changes overtime
C
A line of best fit should be used instead of a line graph.
D
The cost of a school lunch is actually decreasing.
Next
0
0
correct · 0:00