stud
bud
Sign up
Log in
Home
Library
Explore
SAT
More
Econ: Unit 2 Review Flashcards | StudBud
Explore
/
Econ: Unit 2 Review
Econ: Unit 2 Review
31 terms
·
StudBud Administration
·
4,719 plays
A review for Unit 2 (Supply and Demand) for economics. #economics #supplyanddemand
Flashcards
31 cards
F
Practice quiz
P
Host live
L
Questions
31
Answers
1
What would occur on a supply & demand graph for hot wings if hot sauce is found to cause cancer
supply would decrease
supply would increase
demand would increase
demand would decrease
2
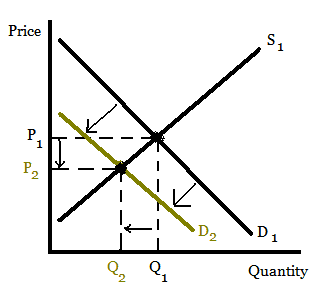
What is occurring in the following supply and demand graph?
decrease in demand
increase in supply
increase in demand
decrease in supply
3
The law of supply illustrates a/an __________ relationship.
indirect
direct
4
Price floors create which of the following?
surplus
shortage
5
If national incomes dropped, what would happen to the supply or demand for Starbucks coffee?
supply would increase
demand would decrease
demand would increase
supply would decrease
6
The prices of related goods like complements and substitutes are connected with
supply
demand
7
The correct label for number 5 on the following circular flow diagram should be:
product market
goods and services
resource market
expenditures
8
How are households dependent on businesses in the resource market?
they need productive resources from the businesses
they need revenue from the businesses
they need goods and services from the businesses
they need income from the business firms
9
This image is supply & demand graph for shoes. After the shift in demand, what occurs?
supply decreases
price decreases
price increases
quantity demanded increases
10
The price of movie tickets has risen from $7 to $9. What is the effect?
the quantity demanded of tickets will increase
the demand curvefor movie tickets will move right
the demand curve for tickets will move left
the quantity demanded of tickets will decrease
11
Consumer incomes are connected with which of the following:
supply
demand
12
What would occur on a supply & demand graph for yogurt if the gov't increased corporate taxes?
demand would decrease
supply would decrease
demand would increase
supply would increase
13
How are businesses dependent on households in the product market?
they need them for revenue as they purchase goods/services
they need them for productive resources
they need them for goods and service
they need them for labor
14
Which scenario for ice tea would cause the shift seen in the graph below?
summertime and sweet tea is popular
the government gives a subsidy to the tea industry
bags used to store tea increase in price
the number of US tea drinkers increases
15
What would occur on a supply & demand graph for t-shirts if the price of cotton decreased?
supply would decrease
supply would increase
demand would decrease
demand would increase
16
What would cause the shift seen below on this supply & demand graph for pizza?
a decrease in consumer incomes
the price of cheese increases
it's Super Bowl Sunday
pizza shops close down
17
The correct label for number 7 on the following circular flow diagram should be:
expenditures
revenue
goods and services
productive resources
18
Improved technology in production is connected to:
supply
demand
19
The government intervention through taxes, regulations, and subsidies affects:
demand
supply
20
Households purchase goods and services from business firms in which part of circular flow?
the product market
the resource market
the shopper's market
the factor market
21
How are prices determined in a (free) market economy?
by private businesses
interaction of buyers and sellers
by the decisions of the government
by the Federal Reserve Bank
22
What could have caused the situation in the graph?
rent control
minimum wage
23
If a hurricane destroyed a number of coffee plantations, what would happen to coffee?
supply would decrease
demand would decrease
supply would increase
demand would increase
24
The price of inputs in the creation of a product is tied to:
supply
demand
25
Households provide productive resources to business firms in which part of circular flow?
the product market
the shopper's market
the public market
the resource market
26
The law of demand illustrates a/an ____________ relationship.
direct
indirect
27
Population increases and decreases impact which of the following?
supply
demand
28
When the selling price of a good goes up, what is the relationship to the quantity supplied?
quantity supplied decreases
quantity supplied increases
29
What would occur to the supply & demand graph for Fruity Circles if Fruit Loops go up in price?
demand would increase
supply would decrease
demand would decrease
supply would increase
30
Shortages appear
below the equilibrium
above the equilibrium
31
The correct label for number 3 on the following circular flow diagram should be:
goods and services
expenditures
revnue
productive resources