stud
bud
Sign up
Log in
Home
Library
Explore
SAT
More
Circle Graphs Flashcards | StudBud
Explore
/
Circle Graphs
Circle Graphs
19 terms
·
StudBud Administration
·
88 plays
6.14 Circle Graph Practice
Flashcards
19 cards
F
Practice quiz
P
Host live
L
Questions
19
Answers
1
What is a possible fraction for the students who chose foreign as their favorite type of movie?
44/50
1/100
7/10
3/4
2
What type of graph is this?
Line Graph
Stem and Leaf
Bar Graph
Line Plot
3
Look at the table below and identify the true statement about creating a circle graph from it:
The number of triples will represent 7/10 of the graph
Homeruns and doubles together will make up less than 1/2
The number of singles will make up 1/2 of the graph
Singles and doubles together will make up 1/2 of the graph
4
Which Jolly Rancher flavor is the most popular?
Blue Raspberry
Apple
Watermelon
Cherry
5
What percent of Meredith's day was spent on activities other than sleeping and eating?
38%
50%
25%
12%
6
What type of graph is this?
Line Graph
Stem and Leaf
Line Plot
Bar Graph
7
300 students were surveyed below. How many more students chose entertainment than education?
60
30
20
90
8
Kylah spent $10 each week for 15 weeks. How much did she spend on books and music?
$50.00
$40.00
$75.00
$35.00
9
Students were asked which ice cream flavor they liked best. What conclusion can be made?
The cafeteria's strawberry ice cream must not be any good
Sally is a student so she must like chocolate ice cream
The school should buy more chocolate ice cream than vanilla
Many students have not tried peanut butter ice cream
10
The two graphs below represent genres of books. Which genre goes in the box labelling the red?
Comic
Geography
Math
Fantasy
11
What percentage of Manuel's classmates selected football or baseball as their favorite sport?
55%
25%
20%
45%
12
Which category has the smallest category?
Gerbil
Bird
No Pets
Reptile
13
Which statement could be true looking at the graph?
Yellow is the least liked color
Yellow and green were the top two colors selected
Red is a very popular color
The majority of people surveyed like the color blue best
14
What is the title of this graph?
Circle Graph
Pepperoni
100%
Favorite Pizza Toppings
15
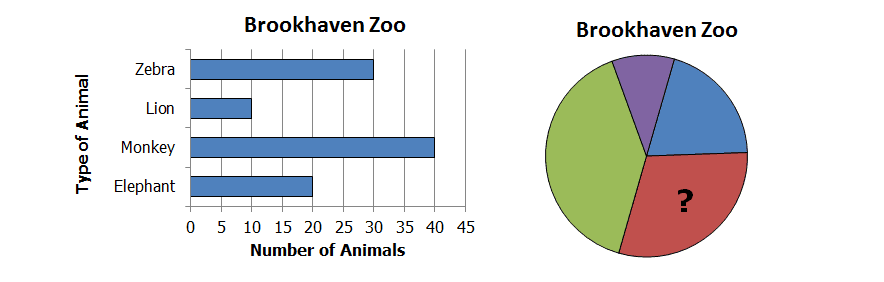
What type of animal is represented by the red sector of the circle graph? Hint: use both graphs
Elephant
Lion
Zebra
Monkey
16
What type of graph is this?
Line Graph
Circle Graph
Line Plot
Stem and Leaf
17
What percentage of students enjoy track?
11
12
30
20
18
Look at the table below and identify the true statement about creating a circle graph from it:
Math will represent 3/10 of the graph
History and Science together will represent 1/2 of the graph
English will be represented by 1/5 of the graph
Science and English together will represent 1/2 of the graph
19
What percentage of students do NOT play soccer?
27
70
30
27